FROM 1850s when the first train ran in India and royal families sponsored its expansion to the present-day envious network and 12,000 trains running daily, railways has connected India like nothing else. Here we look at how things have changed with Indian Railways whether it's the expansion of tracks, jump in freight traffic or even casualties during operations.
The total length of track used by Indian Railways is about 90,000 km of which 24 per cent is electrified. During the last four years, whereas new lines have registered a growth of 74 per cent, Doubling and electrification have grown at 167 per cent & 21 per cent respectively.Though broad gauge had been rising constantly, 1990-91 saw a spurt in this growth at the expense of metre gauge.
The number of persons killed saw a sudden jump in 2003-04 before taking a dip in 2009-10. Most of the times, it's the people other than passengers and railway servants who get killed or suffer injuries in unusual occurrences caused by movement of railway vehicles other than train accidents.
Railway accidents made up 7.9 per cent of the total accidents in the country in 2014. According to data from National Crime Records Bureau, Maharashtra (20.1%), Uttar Pradesh (16%) and West Bengal (10.8%) reported maximum deaths due to train accidents.

However, over all the safety record of Indian Railways compares favourably with that of advanced systems of European Railways. A white paper on Indian Railways, says that the accident rate per million train kilometres in India was 0.201 for 2012-13 as compared to 0.210 over Europe in 2012. Fatalities per billion passenger km of Indian Railways was are 0.240 for 2012- 13 which is also better than that of Europe (1.033).
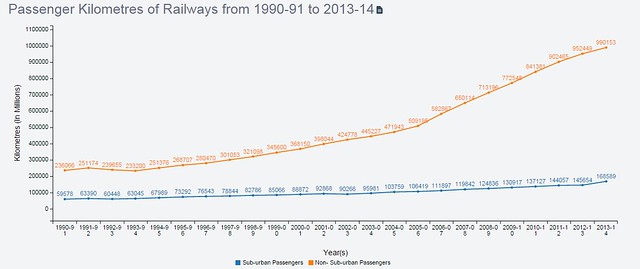
Sub-urban passengers of the Indian Railways travelled 59578 million kilometres in 1990-91 which rose by 183 per cent to 1,68,589 million kilometres by 2013-14. But the growth in non-sub-urban travel was higher as the passenger kilometre in this segment rose by over 319 per cent from 2,36,066 million kilometres in 1990-91 to 9,90,153 million kilometres by 2013-14.

On the other hand, railway density which is measured as train kilometres per running track, also increased in non-suburban areas by 27.6 per cent from 15.2 km per day in 2002 to 19.4 km per day in 2012. During the same time, railway density in suburban area increased by 5.5 per cent from 44 km per day to 46.4 km per day.

Earnings from non-suburban traffic is also the biggest earner and has seen a jump of over 106 per cent between 2005-12. On the other hand, earnings from suburban passengers rose by over 43 per cent in the same period.
During 1999-2012, freight movement via road increased by 8.3 per cent while railways saw an increase of 6.7 per cent. As a percentage of total freight movement, share of road Transport increased by 0.5 per cent, whereas share of railways decreased by 0.9% per cent. .

The Eleventh Plan period (2007-12) has seen steady deterioration in Railway’s financial position which is in sharp contrast with the Tenth Plan performance when the Railway’s had achieved a remarkable turnaround in financial performance. During this period, revenue from gross traffic receipts increased by 84.8% while expenses increased by 106.4 per cent from Rs. 54462 crore in 2007-08 to Rs. 112400 crore in 2012-13. Net revenue increased by 21.3 per cent.

Despite the expansion and rise in earnings, the number of employees has been declining mainly because of several services being outsourced and replacement of manual effort by machines..The drop in railway employees is over 15 per cent between 2000-2013
